饼图中,如果百分比很低的块,字就会非常小,完全看不清,整体看起来科技感,现代感不够,优化一下
注意无论做ppt还是做网站,首先就是元素要能看得清!
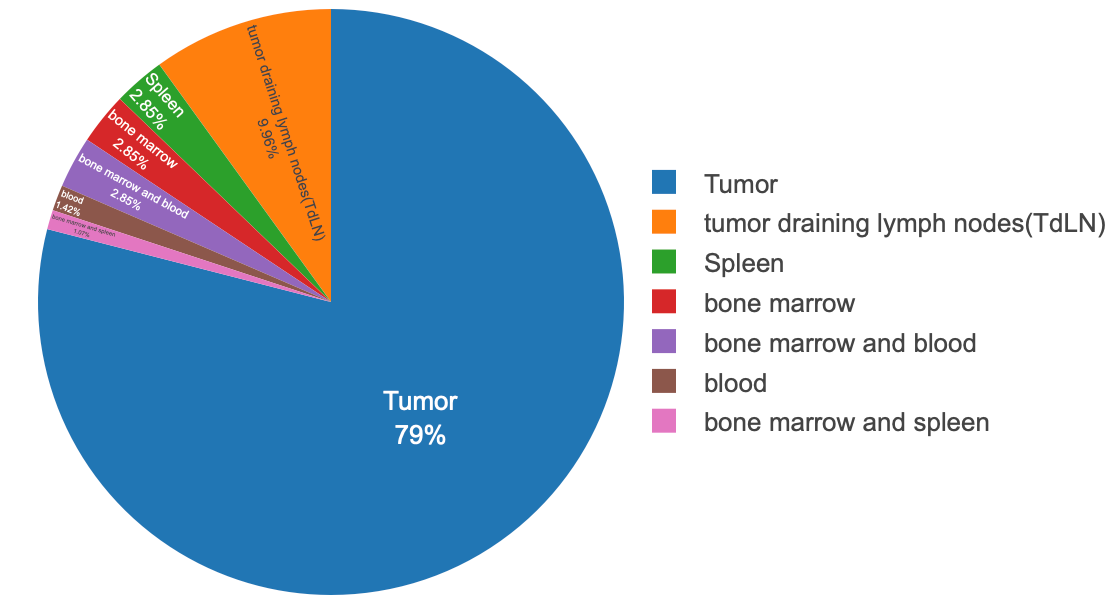
优化后:注意颜色、字体、整体大小、圈大小等可以根据需要调节
代码1:
<!-- ================== XY-Lab Donut(可点选开关 + 布局修好版本) ================== -->

<!-- 1. 液态玻璃卡片样式 --><style>
  .xy-chart-wrapper {
    width: 100%;
    margin: 40px auto;
    display: flex;
    justify-content: center;
    font-family: -apple-system, BlinkMacSystemFont, "SF Pro Text",
                 "Helvetica Neue", Arial, "PingFang SC",
                 "Microsoft YaHei", sans-serif;
  }

  #tissue-pie {
    width: 900px;
    max-width: 100%;
    height: 640px;   /* 上方预留空间给指针文字 */
    background: radial-gradient(circle at top left,
                rgba(255,255,255,0.96),
                rgba(244,244,248,0.96));
    border-radius: 24px;
    backdrop-filter: blur(18px);
    box-shadow: 0 22px 48px rgba(15,23,42,0.22);

    /* ======= 整体缩放 ======= */
    transform: scale(0.7);          /* 想改比例就改这里:0.7 → 0.8 / 0.9 等 */
    transform-origin: center center;/* 以中心为缩放原点,避免偏一边 */
  }


  #tissue-pie canvas {
    width: 100% !important;
    height: 100% !important;
  }
</style>

<!-- 2. 引入 ECharts --><script src="https://cdn.jsdelivr.net/npm/echarts@5/dist/echarts.min.js"></script>

<!-- 3. 容器 --><div class="xy-chart-wrapper"><div id="tissue-pie"></div></div>

<!-- 4. 图表脚本 --><script>
  /* ================== 数据 ================== */
  var data = [
    { value: 79, name:'Tumor'},
    { value: 10, name:'tumor draining lymph nodes (TdLN)'},
    { value: 3,  name:'Spleen'},
    { value: 3,  name:'bone marrow'},
    { value: 3,  name:'bone marrow and blood'},
    { value: 1,  name:'blood'},
    { value: 1,  name:'bone marrow and spleen'}
  ];
  var total = data.reduce(function (s, d) { return s + d.value; }, 0);

  /* 中心图例短名字 */
  var legendShort = {
    'Tumor': 'Tumor',
    'tumor draining lymph nodes (TdLN)': 'TdLN',
    'Spleen': 'Spleen',
    'bone marrow': 'Bone marrow',
    'bone marrow and blood': 'BM + blood',
    'blood': 'Blood',
    'bone marrow and spleen': 'BM + spleen'
  };

  /* Nature/论文风配色 */
  var palette = [
    '#1f4e79', // Tumor:深冷蓝
    '#d98b3a', // TdLN:琥珀橙
    '#4c9f70', // Spleen:绿色
    '#c23b22', // Bone marrow:砖红
    '#7b6ca8', // BM + blood:灰紫
    '#b7a13a', // Blood:土黄
    '#3c8dad'  // BM + spleen:蓝绿湖色
  ];

  /* 初始化图表 */
  var chart = echarts.init(document.getElementById('tissue-pie'));

  var option = {
    color: palette,

    /* ================== 鼠标提示 ================== */
    tooltip: {
      trigger: 'item',
      formatter: function (p) {
        var dot = '<span style="display:inline-block;margin-right:6px;width:10px;height:10px;border-radius:50%;background:' +
                  p.color + ';"></span>';
        return dot +
               '<span style="font-weight:600;">' + p.name + '</span><br/>' +
               'Samples: ' + p.value + '<br/>' +
               'Percentage: ' + p.percent.toFixed(1) + '%';
      },
      backgroundColor: 'rgba(15,23,42,0.96)',
      borderWidth: 0,
      padding: 14,
      extraCssText: 'border-radius:12px;box-shadow:0 12px 32px rgba(15,23,42,0.45);',
      textStyle: {
        color: '#F9FAFB',
        fontSize: 14
      }
    },

    /* ================== 中央图例(可点选开关) ================== */
    legend: {
      orient: 'vertical',
      left: 'center',
      top: 'center',
      itemWidth: 14,
      itemHeight: 9,
      itemGap: 4,
      icon: 'roundRect',

      // ★ 恢复点击开关功能
      selectedMode: true,   // 或 'multiple'

      textStyle: {
        fontSize: 20,
        lineHeight: 24,
        fontWeight: 700,
        color: '#111827'
      },
      formatter: function (name) {
        return legendShort[name] || name;
      }
    },

    /* ================== 环形饼图 ================== */
    series: [{
      name: 'Sample Distribution by Tissue',
      type: 'pie',

      // 粗一点的圈圈,整体略下移
      radius: ['55%', '78%'],
      center: ['50%', '52%'],
      minAngle: 3,
      avoidLabelOverlap: true,

      labelLayout: function () {
        return { moveOverlap: 'shiftY' };
      },

      data: data,

      itemStyle: {
        borderRadius: 10,
        borderColor: 'rgba(255,255,255,0.96)',
        borderWidth: 2,
        shadowBlur: 22,
        shadowColor: 'rgba(15,23,42,0.18)'
      },

      /* ===== 外部标签:整体外移,避免压在环上 ===== */
      label: {
        show: true,
        position: 'outside',
        edgeDistance: 32,   // 离圆环的距离
        formatter: function (p) {
          var pct = p.percent || (p.value / total * 100);
          var shortName = legendShort[p.name] || p.name;
          return '{name|' + shortName + '}\n{pct|' + pct.toFixed(1) + '%}';
        },
        rich: {
          name: {
            fontSize: 16,
            fontWeight: 600,
            lineHeight: 20,
            color: '#111827'
          },
          pct: {
            fontSize: 14,
            fontWeight: 400,
            lineHeight: 18,
            color: '#4B5563'
          }
        }
      },

      /* ===== 指针线:比之前更长一点,远离饼图 ===== */
      labelLine: {
        show: true,
        length: 30,
        length2: 28,
        smooth: 0.35,
        lineStyle: {
          width: 1.3,
          color: '#94A3B8'
        }
      },

      /* ===== 高亮效果 ===== */
      emphasis: {
        scale: true,
        scaleSize: 6,
        itemStyle: {
          shadowBlur: 34,
          shadowColor: 'rgba(15,23,42,0.40)'
        },
        label: {
          show: true,
          rich: {
            name: {
              fontSize: 16,
              fontWeight: 700,
              lineHeight: 20,
              color: '#111827'
            },
            pct: {
              fontSize: 14,
              fontWeight: 500,
              lineHeight: 18,
              color: '#374151'
            }
          }
        }
      }
    }]
  };

  chart.setOption(option);

  window.addEventListener('resize', function () {
    chart.resize();
  });
</script>
代码2:
<!-- ================== XY-Lab Donut(原始版本,适配 Halo + 解决“发布后变小挤在左上角”问题) ================== -->
<!-- 用法:
     1)这段直接放到 Halo 的「自定义 HTML」里即可(同一个模块里也可以)。
     2)如果主题已经全局引入 echarts.min.js,可删掉下面那个 <script src=...>。
     3)核心改动:
        - 去掉 <html><head><body> 等全局标签,只保留卡片本身;
        - 不再修改 body / *,避免影响整站;
        - 初始化时用 initXYDonut() 封装,并在 DOMContentLoaded + 立即 setTimeout + ResizeObserver
          里多次调用 chart.resize(),解决“预览正常、发布后图变小缩在左上角”的问题;
        - 其他图形逻辑基本与你原始代码一致(中心数字随鼠标变动、图例、配色等)。
-->

<!-- 1. 卡片与容器样式(仅作用于 xy-chart-card) -->
<style>
  .xy-chart-card {
    position: relative;
    width: 900px;          /* 卡片理想宽度 */
    max-width: 95%;
    height: 480px;         /* 卡片高度 */
    margin: 40px auto;
    background: rgba(255, 255, 255, 0.85);
    border: 1px solid rgba(255, 255, 255, 0.6);
    border-radius: 24px;

    box-shadow:
      0 20px 40px -10px rgba(15, 23, 42, 0.1),
      0 0 2px rgba(0, 0, 0, 0.05),
      inset 0 0 0 1px rgba(255, 255, 255, 0.5);
    backdrop-filter: blur(20px);
    -webkit-backdrop-filter: blur(20px);

    display: flex;
    overflow: hidden;

    font-family: "Inter", -apple-system, BlinkMacSystemFont,
                 "Segoe UI", Roboto, "PingFang SC",
                 "Microsoft YaHei", sans-serif;
  }

  .xy-chart-card .chart-area {
    flex: 1.6;
    position: relative;
  }

  .xy-chart-card .legend-bg {
    flex: 1;
    background: linear-gradient(to left, rgba(255,255,255,0.5), transparent);
  }

  #tissue-pie-pro {
    position: absolute;
    inset: 0;       /* 等价于 top/right/bottom/left 全 0 */
    width: 100%;
    height: 100%;
  }
</style>

<!-- 2. 卡片结构 -->
<div class="xy-chart-card">
  <div class="chart-area"></div>
  <div class="legend-bg"></div>
  <div id="tissue-pie-pro"></div>
</div>

<!-- 3. 引入 ECharts(如果全站已经引入,可删除这一行) -->
<script src="https://cdn.jsdelivr.net/npm/echarts@5/dist/echarts.min.js"></script>

<!-- 4. 图表脚本:原始逻辑 + 针对 Halo 的大小/加载修正 -->
<script>
(function () {
  /* 封装成单独函数,避免重复初始化 */
  function initXYDonut() {
    if (!window.echarts) return;

    var chartDom = document.getElementById('tissue-pie-pro');
    if (!chartDom || chartDom.__xyInited) return;
    chartDom.__xyInited = true;  // 防止多次 init

    /* ================== 1. 数据准备 ================== */
    const rawData = [
      { value: 79, name:'Tumor',                         color: '#3B82F6' },
      { value: 10, name:'tumor draining lymph nodes (TdLN)', color: '#F59E0B' },
      { value: 3,  name:'Spleen',                        color: '#10B981' },
      { value: 3,  name:'bone marrow',                   color: '#EF4444' },
      { value: 3,  name:'bone marrow and blood',         color: '#8B5CF6' },
      { value: 1,  name:'blood',                         color: '#EC4899' },
      { value: 1,  name:'bone marrow and spleen',        color: '#06B6D4' }
    ];

    const totalCount = rawData.reduce((s, d) => s + d.value, 0);

    const nameMap = {
      'Tumor': 'Tumor',
      'tumor draining lymph nodes (TdLN)': 'TdLN',
      'Spleen': 'Spleen',
      'bone marrow': 'Bone Marrow',
      'bone marrow and blood': 'BM + Blood',
      'blood': 'Blood',
      'bone marrow and spleen': 'BM + Spleen'
    };

    const colors = rawData.map(d => d.color);

    /* ================== 2. 初始化 ECharts ================== */
    const myChart = echarts.init(chartDom);

    const option = {
      color: colors,

      tooltip: {
        trigger: 'item',
        backgroundColor: 'rgba(255, 255, 255, 0.95)',
        borderColor: '#E5E7EB',
        borderWidth: 1,
        padding: [10, 15],
        textStyle: { color: '#1F2937' },
        extraCssText: 'box-shadow: 0 10px 25px rgba(0,0,0,0.1); border-radius: 8px;',
        formatter: (params) => {
          const percent = params.percent.toFixed(1);
          return `<div style="font-weight:600; margin-bottom:4px; color:${params.color}">${params.name}</div>
                  <div style="font-size:13px; color:#666">Samples: <b>${params.value}</b></div>
                  <div style="font-size:13px; color:#666">Ratio: <b>${percent}%</b></div>`;
        }
      },

      legend: {
        orient: 'vertical',
        right: '20%',
        top: 'middle',
        itemGap: 18,
        icon: 'circle',
        itemWidth: 10,
        itemHeight: 10,
        textStyle: {
          fontSize: 14,
          color: '#4B5563',
          rich: {
            name: { width: 90, fontSize: 14, fontWeight: 500, color: '#374151' },
            val:  { width: 40, align: 'right', fontSize: 14, fontWeight: 700, color: '#111827' }
          }
        },
        formatter: function (name) {
          const item = rawData.find(i => i.name === name);
          const shortName = nameMap[name] || name;
          return `{name|${shortName}}{val|${item ? item.value : ''}}`;
        }
      },

      graphic: {
        elements: [
          {
            type: 'text',
            left: '28%',
            top: '43%',
            style: {
              text: 'Total Samples',
              textAlign: 'center',
              fill: '#9CA3AF',
              fontSize: 14,
              fontWeight: 500
            }
          },
          {
            id: 'center-main-text',
            type: 'text',
            left: '28%',
            top: '48%',
            style: {
              text: String(totalCount),
              textAlign: 'center',
              fill: '#111827',
              fontSize: 36,
              fontWeight: 700,
              fontFamily: 'sans-serif'
            }
          }
        ]
      },

      series: [
        {
          name: 'Source',
          type: 'pie',
          center: ['33%', '50%'],
          radius: ['58%', '72%'],
          avoidLabelOverlap: true,
          itemStyle: {
            borderRadius: 8,
            borderColor: '#fff',
            borderWidth: 3
          },
          label: {
            show: true,
            position: 'outside',
            formatter: function(p) {
              if (p.percent < 3) return '';
              return `{rate|${p.percent.toFixed(0)}%}`;
            },
            rich: {
              rate: {
                fontSize: 13,
                color: '#6B7280',
                fontWeight: 600,
                padding: [0, 4]
              }
            }
          },
          labelLine: {
            show: true,
            length: 15,
            length2: 10,
            lineStyle: { color: '#E5E7EB', width: 1 }
          },
          emphasis: {
            scale: true,
            scaleSize: 8,
            label: { show: false }
          },
          data: rawData
        }
      ]
    };

    myChart.setOption(option);

    /* ================== 3. 中心文字交互 ================== */
    myChart.on('mouseover', function(params) {
      if (params.componentType === 'series') {
        const shortName = nameMap[params.name] || params.name;
        myChart.setOption({
          graphic: [
            {
              // 第一个 elements(上面那行)
              style: { text: shortName, fill: params.color }
            },
            {
              id: 'center-main-text',
              style: { text: String(params.value), fill: '#111827' }
            }
          ]
        });
      }
    });

    myChart.on('mouseout', function() {
      myChart.setOption({
        graphic: [
          {
            style: { text: 'Total Samples', fill: '#9CA3AF' }
          },
          {
            id: 'center-main-text',
            style: { text: String(totalCount), fill: '#111827' }
          }
        ]
      });
    });

    /* ================== 4. 尺寸修正:解决“发布后缩在左上角” ================== */
    function safeResize() {
      myChart.resize();
    }
    // 初次渲染后立即 / 延迟多次 resize,适配 Halo 发布页重新排版
    setTimeout(safeResize, 0);
    setTimeout(safeResize, 200);
    setTimeout(safeResize, 600);

    // 浏览器窗口尺寸变化
    window.addEventListener('resize', safeResize);

    // 如果支持 ResizeObserver,则在卡片大小改变时自动调整
    if (typeof ResizeObserver !== 'undefined') {
      var ro = new ResizeObserver(function () {
        safeResize();
      });
      ro.observe(chartDom.parentElement || chartDom);
    }
  }

  // 支持 Halo 可能的多种加载方式
  if (document.readyState === 'loading') {
    document.addEventListener('DOMContentLoaded', initXYDonut);
  } else {
    initXYDonut();
  }
})();
</script>
评论